What are some of the most crucial dashboard views your CPG business needed yesterday in order to measure how the work your teams get done in the field impacts sales? Whether your brand sells snacks or sneakers, understanding how your reps are working in the field to meaningfully move the needle on growth is important to your brand’s long-term success. As consumer excitement to get back shopping in-stores continues to grow as more states eliminate restrictions, now more than ever, brands need to have real-time insights into how their products perform in their top accounts. Equipping your field team with a dedicated retail execution platform will give your brand and broker field teams a clear understanding of their potential output and current performance at scale.
In this blog, we’ll explore three crucial dashboards your CPG business needed yesterday that every modern retail execution platform should be able to report on in real-time.
Team Activity Dashboard
The first dashboard a team manager looks at every day should include a quick snapshot of their team's most important activity metrics so they can quickly see how they're tracking toward goals and identify areas of improvement to focus on for the day. A dashboard view like this is important for every brand to have and is foundational to modern retail execution platforms.
Below are some top KPIs your brand should track on your Team Activity dashboard:
- Visits
- Account coverage
- Total number of working reps
- Average visits
- Displays built
- Out-of-stocks corrected
- Facings gained
- Competitors displaced
Keep in mind that viewing the key metrics above like visits and account coverage are fantastic pieces of data to have, they’re only useful to your business if you know how that compares to previous months. For example, if you notice that your field team made 650 visits last month and compared to 750 the previous month, you can drill down and understand the why behind those numbers.
Brands with larger field teams — especially those in which not everyone works a full day every day — may be interested in measuring working reps so they can estimate payroll. Other teams may be interested in keeping an eye on the percent of reps working any given week so they make sure everyone on the team is staying engaged. While the specific metrics might vary from team to team, most field teams can benefit from seeing who's working at-a-glance.
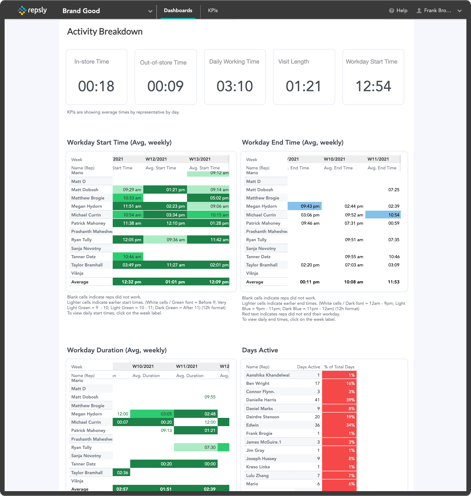
Detailed Time & Mileage Dashboard
Does your retail execution platform track how long your field reps is working each day? While it’s nice to know your reps working full days, tracking key workday duration metrics are actually far more important for businesses to understand if coverage is properly being allocated.
Here are a few time and mileage metrics we think your brand needs to track:
- Average time working in-store
- Average miles a day by rep
- Time in-store vs. time on the road
- Workday start and end time
- Number of hours a rep is working
For example, if every rep has agreed in their contract to work 8 hour days, but some routes require 10 hours to complete while other routes only require 5 hours, by taking a close look at how much time their reps spend in the store vs on the road and then comparing those metrics by team or territory, managers may find opportunities to improve territory allocation or personnel balance. And if you’re thinking right now, “I already have a time & mileage report,” bear in mind that it if only reports on total mileage for each field rep each week it just might not providing sufficient enough data.
Field managers can also go a level deeper and use these metrics to assess what could be causing an issue like low coverage. If territory coverage is low yet your team is already working 8 hour days, it may be time to hire additional reps and expand the team. If that isn’t the issue, by checking mileage per rep, field managers can assess if reps are spending too much time driving vs. in key accounts, and adjust territories and schedules as needed.
Conversely, if coverage is low but your reps are only working 4 hours days, the issue may be getting the team to work full days. Whatever you uncover the issue to be, a detailed Time and Mileage dashboard is critical to every brand’s success in uncovering the why behind coverage challenges and helping them turn the right levers to improve coverage.
Photo Gallery Dashboard
The last dashboard your CPG business needed yesterday is a Photo Gallery with highly customizable powerful filters. Photos are a fantastic way to validate all of the hard work your team achieves in the field each day, yet so many brands today still struggle to filter and find photos from specific promotions, stores, or SKUs.
With filtering options in your Photo Gallery dashboard that allow you to determine A) the type of store, and B) the type of execution or program that each photo is attached to, brands can quickly sort and find any relevant photo with ease, rather than searching through hundreds of similar photos dumped in emails, chats, and texts.
Additionally, brands are leveraging the filters in a Photo Gallery dashboard to share displays built with different retailers or their own marketing and sales teams. By just sorting to that store or a specific program, brands have total control and insight into what the exact execution of their field team looks like at scale.
So instead of wondering, “Where was this photo taken?” Your Photo Gallery should be your go-to resource for finding how your brand set up that stellar BOGO endcap in Walmart two summers ago or for highlighting an incredible display a field rep recently built. With so much incredible data stored in the photos your field reps take every day, it’s really important your retail execution platform can help turn those photos into business insights.


.png?width=770&height=404&name=3%20field%20team%20dashboards%20(1).png)
.png?width=480&height=252&name=PRESS%20RELEASE-2%20(4).png)

