Mastering the retail channel is a massive opportunity for CPG brands, but those who have played in the space before know it takes a committed investment to reap the benefits. To make the most of that investment, CPG sales and marketing teams are putting data at the forefront of their retail execution efforts, unlocking the insight they need to expand their in-store footprint by prioritizing and maximizing high-opportunity initiatives.
In this blog, we’ll outline how you can take a data-driven approach to expand your in-store footprint by leveraging activity, observational, and sales data.
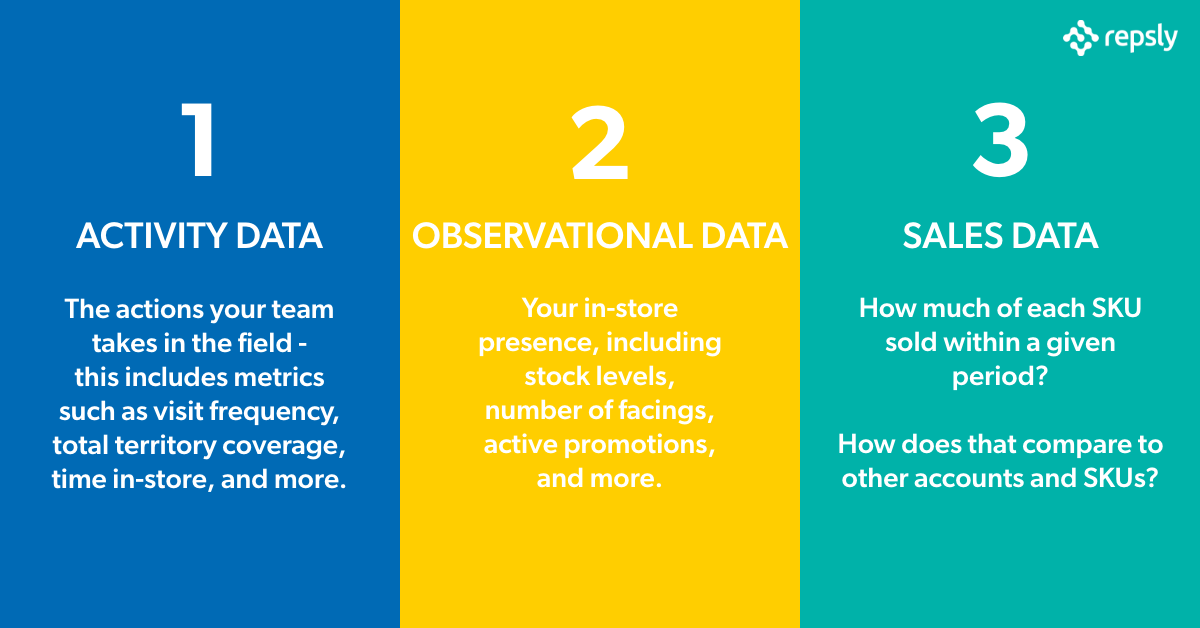
Activity Data
The most effective CPG field teams know that having a great product and strong initial sales are what get a product in-store, but consistent and reliable retail execution is how winning brands keep their product on the shelf and expand. Brands should be regularly tracking the actions the team takes in the field, including metrics such as visit frequency, total territory coverage, time in-store, and more. This type of data is referred to as activity data.
Take a look at some of the ways brands are leveraging the activity data they collect on their team’s actions in the field:
- Showing store managers that their reps are checking in regularly and maintaining displays helps to build confidence that future displays will be maintained just as well.
- Knowing when reps are next set to visit a retail location means brands can plan their pitches in advance, and know what other data they’ll have to support their arguments.
- When negotiations happen for multiple locations at once, brands use their activity data to show the completeness of their territory coverage - leaving retailers comfortable that those shelf locations will be properly set-up and maintained.
Observational Data
Forward-thinking brands understand that to quickly improve sales within a chain or territory, they need a clear picture of what their exact presence is in each store. Combining photos, structured data, and notes from reps allow managers to paint a distinct picture of what’s happening in each store so that they can continue to learn and improve. We measure the in-store presence, including stock levels, the number of facings, active promotions, and more through observational data.
Here are a few ways the brands you love are leveraging observational data:
- Reps should be having regular conversations with store-managers and trying to discover when the opportunity for additional placements may arise - when reps are consistently recording their interactions in-store, it becomes much easier to recognize and act on those opportunities.
- When sales are strong, reps look to see what kinds of shelf-placement or displays those sales occurred from - then present that data at a new store within the chain to justify those same placements.
- If sales have been lackluster, reps look to observational data to build a stronger case as to why their brand deserves more shelf space. In many cases, poor maintenance by the retailer or a recently-lost display are the cause of lost sales, and showing this to retailers can help you better maintain or re-secure those placements.
Sales Data
Some of the fastest-growing CPG brands are providing their reps in the field with POS data from the stores they sell directly into. By having this sales data in-hand, reps can build a narrative - backed by data - as to why their brand deserves that prime spot on the shelf. By measuring sales data, brands have the ability to track key metrics including how much of each SKU sold within a given period, and how their product compares to other accounts and SKUs.
Here are just a few of the ways the top teams are utilizing sales data to secure even higher sales at their top-priority chains:
- Giving teams access to POS data while on-the-go, so they can build their case for additional placements with store managers.
- Looking for out-of-stock indicators in sales data - if there is a pattern of steady sales followed by a steep drop-off, this is a good indication that you’ve lost a placement.
- Using strong initial sales from a new SKU to justify additional placement in-store.
- Using upward sales trends to prove demand for top products and make a case for secondary placements.
Together, these three types of data give CPG sales and marketing organizations a complete picture of how their products are presented, sold, and supported in all of their accounts, shining a light on how and when brands can deploy their field teams to have the biggest impact in the store.
Many of the fastest-growing consumer brands in the world are leveraging the insights they gain from activity, observational, and sale data to gain huge competitive advantages over other brands in their space.
Explore the 3 Types of Data to Explode Sales to learn four more ways high-performing retail brands are leveraging structured and reliable data to have the biggest impact in the store.


.png?width=480&height=252&name=PRESS%20RELEASE-2%20(4).png)

