When it comes to the CPG industry, utilizing data in your overall business strategy is key to staying ahead of the curve. Top performing brands take a data-driven approach to their businesses and identify insights and trends to inform business decisions. A data-driven company leverages their CPG data analytics to create a cycle of continuous improvement in the field, allowing them to constantly evolve and adapt.
In this blog post, we will go through everything you need to know about using CPG data analytics to get more out of your team’s efforts and improve the returns you get from the investments you make into sales and marketing. We will discuss what exactly CPG data analytics are, why collecting and evaluating them is important, and the different ways that data analysis can propel your team forward.
What are CPG Data Analytics?
CPG data analytics refers to the collection and analysis of data points resulting from any sales marketing actions a team is taking in the field. Focusing on data helps CPG brands take the data they are collecting and turn it into useful information by analyzing it and spotting trends. Think of it this way: data are the different points on a graph. Analytics are the insights you get from studying that graph.
.png?width=386&name=threekeytypesofdata%20(1).png)
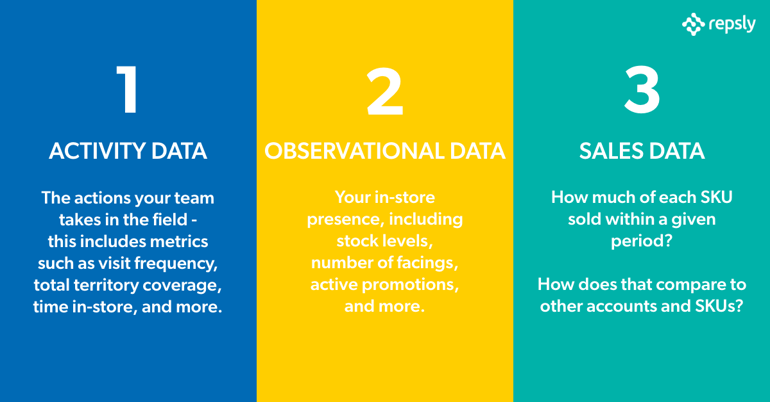
In CPG data analytics, there are three main sources of data brands should pay attention to: observational data, activity data, and sales data.
Observational Data
By Observational Data, we mean the in-store conditions your reps are observing and reporting from the field. This paints a picture of both your execution in the store as well as opportunities your reps uncover during their visit. Sample metrics include stock levels, number of facings, competitive activity, promotional compliance, and more.
Activity Data
Next up is Activity Data. By Activity Data we mean the specific actions your team is taking in the field. How often are they visiting accounts, how well are they able to cover their territory, which actions are they taking most frequently in the store? Activity Data paints a picture of the specific actions your team is taking to improve execution in the store. Measuring and tracking these actions is key to understanding which have the highest impact on sales.
Sales Data
That brings us to the third key data type -- Sales Data. Sales Data is simply how much of each product is sold over a certain period at certain store locations. This one is straightforward, and is likely one your brand is already tracking. But it takes on new meaning when associated with your team’s Observational and Activity Data -- giving you a sense of which activities and store conditions lead to the highest sales.
So to recap, there’s Observational Data -- the in-store conditions your reps report from their accounts, Activity Data -- the actions your reps are taking in the field to drive sales, and Sales Data -- the volume of your products moving off the shelf.

To learn more about how you can leverage these types of data, check out our eBook on using three types of data to explode sales!
The Cycle of Continuous Improvement
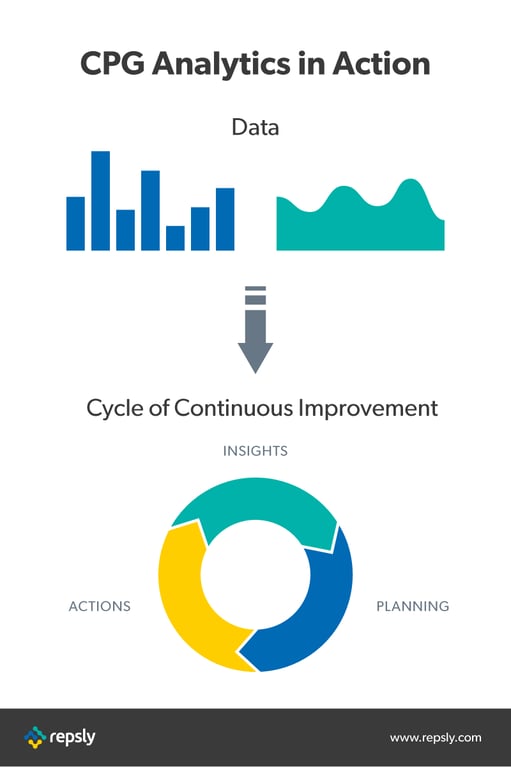
Once you’ve analyzed your data and gathered your information, the next step is to plug that information into a cycle of continuous improvement that will help grow your brand. This cycle empowers brands to take the insights they have uncovered and use them in a planning stage to then take data-driven action in the field. These three components -- insights, planning, and action -- are what make up the cycle.
Insights
At a high level, every action in the field starts because of some Insight. An Insight is simply an indication from your data that there is a problem or opportunity in the field that you can address to have an impact on sales.
Planning
From there, you enter the Planning stage -- analyzing past performance to decide when, where and with whom you will address that opportunity, and exactly what steps they should take in the store to deliver the highest impact.
Action
Once you’ve deployed your team, we’ve entered the Action stage. Your reps execute your plan in their targeted accounts, and report back data about the in-store conditions they encountered and were able to affect. The data those activities generate feed back into your data set, and inform the next set of Insights that kick the process off again.
This cyclical process drives peak performance because it allows field teams to constantly improve. Every action they take in the field is informed by real-time data, both about current store conditions and the results past campaigns have had on sales. The cycle of continuous improvement empowers teams to take the right action in the right store at the right time, maximizing both their efficiency and the impact they have on sales.

How CPG Data Analytics Can Improve Efficiency in the Field
By tracking the three types of retail data mentioned earlier and using that to fuel your cycle of continuous improvement, you empower yourself and your team to quickly and effectively address the following questions:
-
- Where are my out of stocks?
- What is the relationship between visit frequency and sales performance?
- What is the relationship between compliance and sales performance?
- Which of my stores are typically in/out of compliance?
- Which high-volume stores are seeing unusually low sales, and haven’t been visited by a rep yet this month?
Below we’ve listed just a handful of solutions to these problems that taking a data-driven approach provides you with.
Predict Consumer Activity and Plan Ahead
Doesn’t it make you cringe thinking about how many times you may have missed out on sales because you didn’t catch an out-of-stock in time? CPG analytics can be used as a predictive tool for brands to prevent this fumble. With a data-driven team, you will be aware when your stock levels at a certain retailer are decreasing so you can replenish your shelves before customers are forced to opt for a competitor’s product.
Better yet, if you have a long-term analytics strategy, you’ll start to identify and understand patterns within different retailers. You will be able to more accurately predict when to adjust order sizes. This will save yourself, your reps, and store employees the stress of having to do a last minute scramble for stock replenishment, improving your overall in-store strategy.
Ensure Display Compliance at Key Retailers
Beyond simply securing in-store displays, flawless retail execution must focus on retailer compliance. While CPG displays have the potential to move the needle on sales by as much as 193%, they’re executed to compliance less than 50% of the time.
Innovative CPG brands can use data analytics to identify noncompliance and win back lost sales. By keeping a close eye on sales in stores where you’ve negotiated and delivered a secondary display, you’ll be able to establish baseline metrics for the sales lift you can expect certain promotions to produce in certain accounts. With those baselines in hand, it’ll be clear just a few days after a scheduled promotion whether there’s something wrong with the display setup or location.
From there, data-driven teams can deploy their field team to take action at those target accounts. Armed with POS trends, they’ll be able to start data-driven conversations with the retailers and take the necessary steps to correct the displays and win back those sales.
Tell a Data Story and Gain Shelf Share
Getting your product on store shelves can be one of the hardest parts about running a CPG business. Plenty of brands, tons of competition, and only so many shelves to go around! Rather than relying on buzzwords or anecdotal testimonies, set your products apart by using data and analytics to tell data stories to retailers.
Data stories take the messaging you interpret from your analytics and make it into something easily digestible for the reader. They interpret information that may otherwise be represented through confusing graphs and charts and communicate it in a clear, less technical manner.
Track KPIs and Get Closer to Your Goals
KPIs, or key performance indicators, are a set of metrics teams agree on tracking to measure how well they are working towards their goals. They are quantifiable, which means they become data that can be analyzed as part of a comprehensive strategy of improvement. KPIs can focus on things like sales volume and growth, rep visits over a period of time, new and churned accounts, and more.
KPI data will provide insights as to what you can address in the field to improve your team’s performance. When deciding which KPIs to measure, be sure to pick S.M.A.R.T. indicators - Specific, Measurable, Actionable, Relevant, and Timely. Once you have tracked your KPIs for some time, analyze them and look for where you and your team excelled and where you fell short. Use the information you gather to feed your cycle of continuous improvement and take actions that deliver the highest impacts.
CPG Data Analytics Recap
As we can see, the value created by investing in CPG data analytics is exponential. In the short term, tracking CPG data gives you a highly accurate snapshot of what is going on in multiple retailers in real-time. As a long term strategy, tracking this data and plugging it into a cycle of continuous improvement empowers you and your team to make more informed decisions in the field so you can better allocate your resources and ensure your field activities are having the highest impact possible.
Repsly’s retail execution solution was built specifically to support the cycle of continuous improvement, empowering brands with the data and tools they need to achieve peak performance in the field. To learn more, schedule a time to chat with us!

.png?width=770&height=404&name=cpg%20data%20analytics%20(1).png)
.png?width=386&name=threekeytypesofdata%20(1).png)


.png?width=480&height=252&name=PRESS%20RELEASE-2%20(4).png)

