Many brands focus heavily on getting as wide of a distribution as possible. But a product on a shelf does not equal instant success. In fact, quite the contrary -- sometimes it's not about the number of retailers you’re in, but rather the quality of those retailers. What do we mean by quality? To put it simply, it might make more sense to be sold in a single high-volume store than a dozen low traffic doors.
What Is % ACV?
So how do we measure our product distribution in a way that takes into account the selling potential of our retailers? Luckily, there is a super helpful metric we can employ that gives us a great snapshot of the quality of our distribution network. This metric is usually referred to as“% ACV”, which stands for “all commodity volume.” This number is a measurement of a store’s total sales of all products relative to the sales of all relevant retailers in a given territory.
Why % ACV Matters for CPG Brands
Why should you care about the total sales of all products, though, when your products only make up a fraction of that number? The answer is that % ACV can provide brands with insight into which locations to prioritize when it comes to distribution, by showing the “size” of the store not based on physical square footage or the number of facings, but on the amount of product that specific retailer is actually moving off of the shelves.
What kinds of questions does % ACV answer for brands? Below are a few:
- Which retailers should I focus on distributing to in a given territory?
- Why is my product not selling in a certain territory despite widespread distribution?
- Why is my product selling so much faster in a few given locations?
% ACV Calculation
So now, how do we measure % ACV? The formula is pretty simple. Let’s check it out below, and then move into a detailed example to show exactly how this calculation is useful.
Q1 of 2019 is right around the corner, and Solar Sparkling Water wants to know where to scale up their distribution efforts in the new year. Currently, Solar products are distributed within a given territory in Store 1 and Store 2, but not Store 3.
In the past, Solar has focused on winning facings in Stores 1 and 2 and not Store 3 for a few different reasons. First of all, Store 1 and Store 2 both have multiple locations throughout the region. Store 1 is a well-known chain, and Store 2 is comprised of regionally famous mom-and-pop style shops. Additionally, Solar has a special relationship with Store 2 and is able to occupy more facings in these locations than others. Solar hasn’t focused on Store 3 because they are a single outlet, wholesale retailer, carrying lots of competitors and seemingly reaching less of the market.
Solar traditionally has used sales velocity as a guide for where to focus sales efforts. This time, they want to figure out if the key to selling more is actually hidden in their distribution network using a % ACV retail calculation. There are two ways to determine distribution: weighted and unweighted. Below we list the % ACV per individual outlet and whether or not Solar Sparkling Water is sold there. Brands can acquire this data either directly from retailers or by investing in syndicated data to get a fuller picture.
Store 1: Yes, $40 million ACV
Store 2: Yes, $10 million ACV
Store 3: No, $50 million ACV
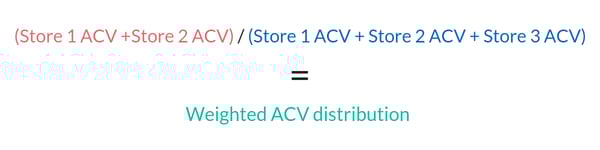
Now, let's find the unweighted % distribution for Solar Sparkling Water. The unweighted % distribution is simply how many stores Solar is sold in divided by the total number of stores. Solar is sold in two out of three of the regional retailers being surveyed, meaning they are at about 67% distribution for the area. But what about weighted % ACV distribution? To find this metric, we must do some simple math using the formula we presented earlier:

Here, we are dividing the sum of ACV for Stores 1 and 2 because Solar’s products are being distributed there. We are then going to divide that sum by the total ACV for Stores 1, 2, and 3, as that represents the total sales occurring for the region.
Using the above formula, we now see that while Solar is distributing in 67% of the outlets surveyed, they are only reaching about 50% of the available market. This means they are missing out on up to 50% of regional sales by not distributing to Store 3! Because Store 3 represents such a high portion of the % ACV retail for this territory, it is clear that Solar Sparkling Water will have a new priority in 2019: distributing to Store 3. Using % ACV, Solar was able to derive insights into their distribution network that simple sales data never could have given them.


.png?width=480&height=252&name=PRESS%20RELEASE-2%20(4).png)

