For CPG brands, the battle for market share is as old as time. But in an era where most shopper decisions are made in-store at the fixture and shelf space continues to decrease as new brands emerge, growing your brand’s market share has never been more difficult.
Fortunately, winning brands are gaining a competitive edge by leveraging technology to analyze their market share versus their shelf share so that they can ensure trade spend is optimized with a good product mix so that the strongest brands are always available, detect distribution voids, and to identify opportunities for growth on the shelf.
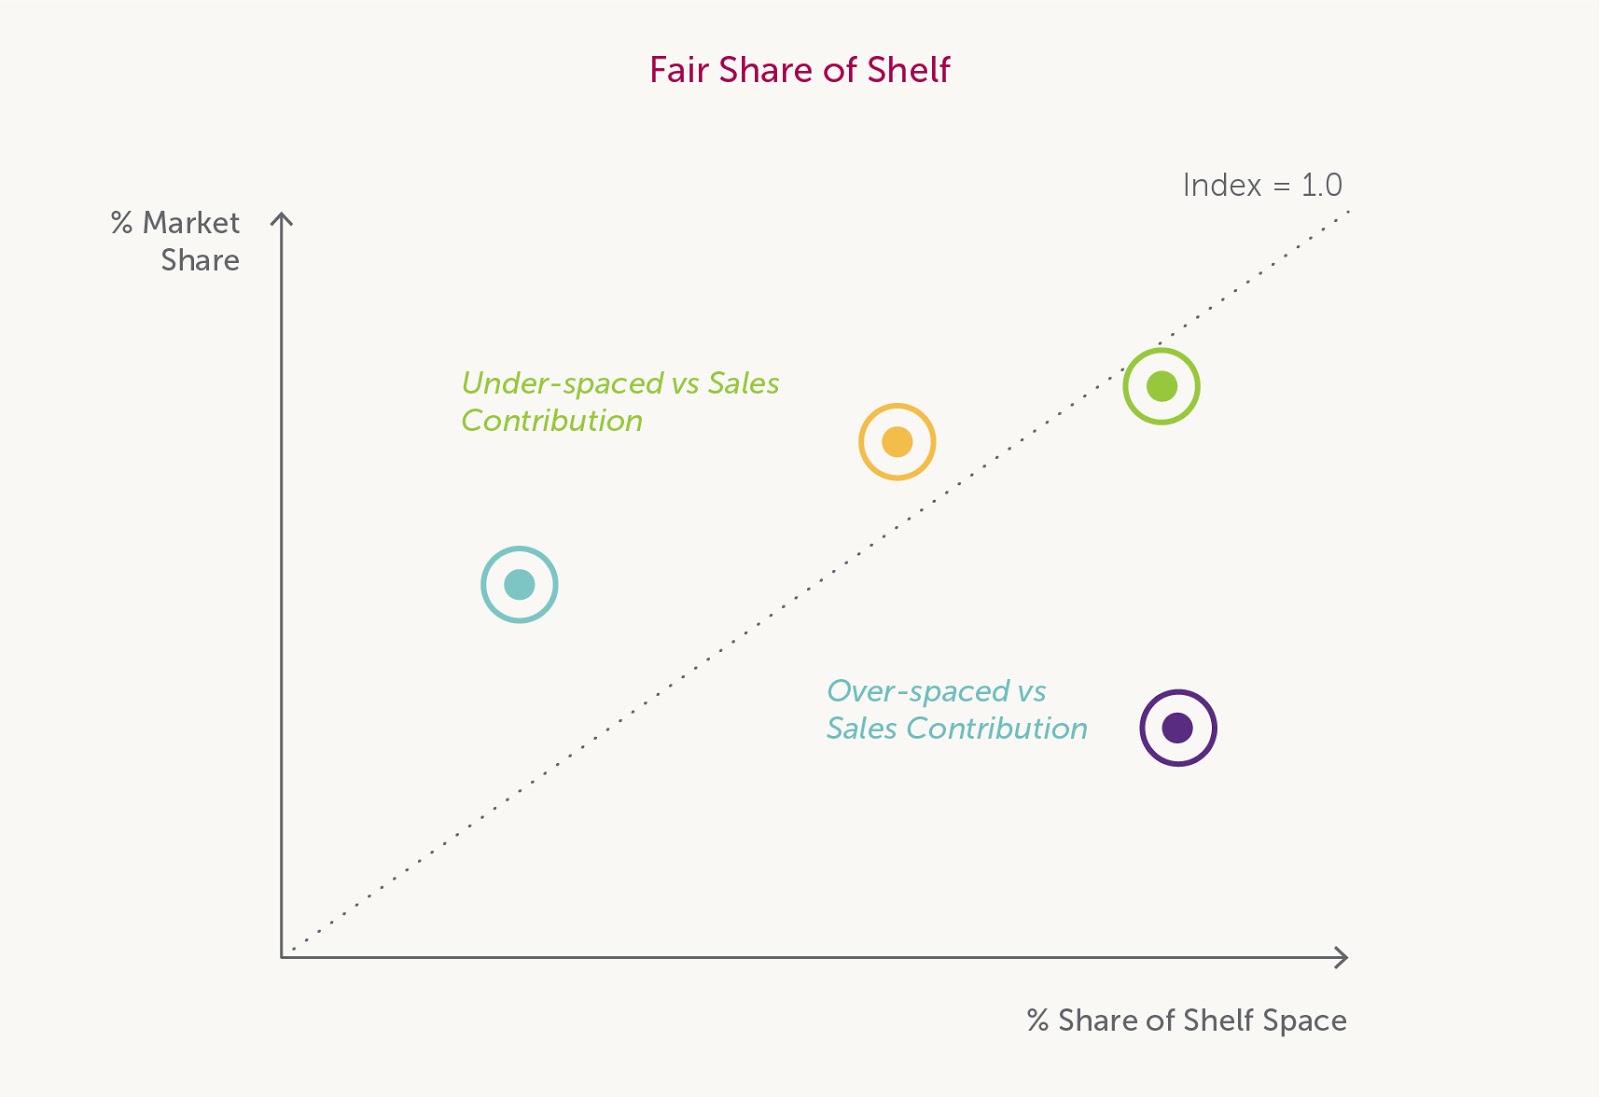
What exactly is shelf share an how does it differ from market share? Shelf share is very similar to market share but is based on space allocation instead of sales performance. Forward-thinking companies have begun to compare both to have a better understanding of the competitive landscape in stores.
We recently had the opportunity to speak with Ivan Jurković, business intelligence manager at Franck, and longtime Repsly customer, on how they’ve measured and combined their shelf share data with their POS data to become one of the most successful producers and exporters of coffee and tea in Croatia.
Why Franck Tracks Shelf Share vs. Market Share
Most brands will calculate shelf share in one of two ways: Facings and Linear Shelf Space. The former counts the number of your product’s facings compared to the total number of facings of all other products in that category. While the latter measures the physical shelf space owned by your product compared to total shelf space owned by that category.
For the past several years, Franck has chosen to measure their physical shelf space to gauge how hard their products are working on the shelf. “We measure shelf share in centimeter for every shelf total, our brands, as well as our competitors’ brands,” said Ivan. “The data is then continuously downloaded to our business warehouse where calculations are done daily.” They then compare the report with their internal sales data to gain insights.
Ivan explained why it’s so crucial to continuously monitor and compare these data points. “As shelf positioning became increasingly more challenging to maintain, it was important that we created a quality management mechanism that could find a correlation between the distribution of a product on a shelf and it’s sales data,” said Ivan. Pinpointing these opportunities and gaps has been a big advantage for Franck over their competing brands, he added.
For example, if Ivan saw a mismatch between shelf share and sales – say a product with a small shelf share had very high POS sales uplift, while another product that had high shelf share was showing very low POS sales at the same stores – he could adjust their product mix strategy in that store to better serve the market’s needs and assure the right products are always on the shelf.
Use Sales Data to Detect Distribution Voids and New Opportunities
One of the main reasons for choosing to compare the shelf share data with the sales data is that it shows the strength of each product in that market, as well as if any facing may have gone missing over time.
“The share on the shelf has a significant, but not crucial role in achieving our sales results. We use the insights we gain in negotiations with key customers in explaining why our products are deserving of more shelf space over our competitors given their shelf share relative to the larger market,” explained Ivan.
Understanding how much shelf-space you have in relation to the total market share is key to knowing if you’re outperforming expectations, or falling behind. Without the data to manage which accounts you’re behind in, you’ll never have the ability to catch up to your competitors.
Franck also uses this data to detect distribution voids. By utilizing their point of sale data from retailers, distributors, or syndicated sources data, Franck can identify distribution voids without their reps physically being in the store. Instead, they can use the data from these reports to cross-reference SKU-level sales with the list of products approved for distribution, and take action to replenish high-performing products before competitors move in on the empty spaces left frequently by your best selling products with lower shelf shares relative to their market share.
In today’s age of big data, brands that can leverage their point-of-sale data to find actionable growth opportunities will outsmart their competition and become top performers in their field. Check out the CPG Sales Guide to learn five ways your brand can use POS data to prioritize accounts and grow sales in near real-time.


.png?width=480&height=252&name=PRESS%20RELEASE-2%20(4).png)

