In the competitive CPG space, your ability to execute at retail plays a massive role in your business’s success. Using in-store promotions is one of the most popular and effective ways to boost your sales, but only if you know how to determine the effects of the product promotion on your company in a promotion analysis. Having a data-driven approach and measuring your results will show you what your invested funds have achieved, and prove whether your field efforts are actually improving your sales. At the end of the day, data is your biggest ally, as it will tell you where you’ve been, where you’re heading, and where you want to be. Here are the four main metrics you should use to analyze data on the success of your in-store promotion, as well as some suggestions on how to leverage this data:
1. Profits
Promotions, like other investments, fundamentally work by earning revenue in exchange for a smaller investment. It is important to evaluate the impact of sales promotions on profit because it is possible for promotions to lead to higher sales but lower profits. Only 30 out of 45 promotions reported as successes are actually successful, while 19 out of 46 promotions reported as failures actually increased profits (Hardy 1986).
In order for a promotion to be profitable, incremental customer sales must increase and the cost of obtaining one dollar in increased sales must not exceed a dollar. These are measurements you need to pay attention to before, during, and after the promotion, as having solid metrics will give you a clearer view of the effects of your promotion. In the example below, the cost per incremental dollar of sales is $0.64. If the margin that the manufacturer receives from the retailer is less than $0.64, then the promotion is not profitable to the manufacturer.

2. Sales Volume
In order to accurately measure the increase in sales volume, you need to know your baseline (what sales were prior to the promotion) using both data you’ve already collected and data you collect throughout the duration of the promotion. This equation can be used to find your overall increase in sales:
Overall Sales Lift = Lift in Promoted Item Sales + Halo - Cannibalization - Pull-forward
Lift in Promoted Item Sales: The difference between the sales baseline and the new sales volume.
Halo: The effect that occurs when promoting one item leads to an increase in sales of another item. Measure using basket analysis - look at historical transactional data across multiple promotional periods and analyze all baskets that contained the item promoted and determine among all those baskets which were the common items that were not on promotion (“Guide To Analyzing The Overall Lift Of A Retail Promotion”).
Cannibalization: When the promoted item’s sales increase but “eats up” the sales of another item. This can lead to a lower category lift.
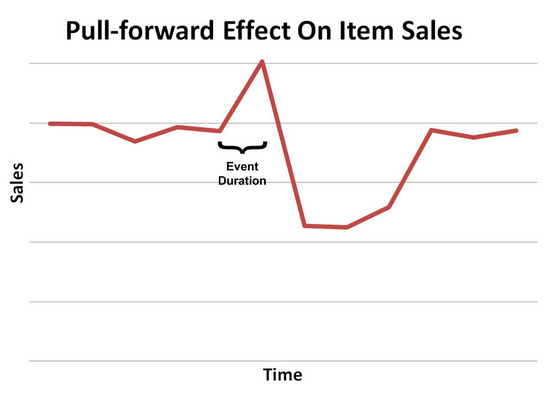
Pull-forward: When the sale item is something that consumers regularly purchase and has a longer shelf-life, causing consumers to stock up on the item while it’s on sale, causing a spike in sales during the promotion and a dip in sales after the promotion.

Source: Cross Cap
3. Customer Satisfaction
Customer satisfaction is a key facet to customer loyalty and long-term brand switching, so it is important that you measure customer satisfaction by collecting data to measure exactly how satisfied customers were with your promotion and with your overall product. Some things to look at: Did you experience more out of stocks than usual because your product was flying off the shelves? What are people saying about your brand or product online? If you are interested in gaining deeper insight, try inviting your customers to fill out a quick survey or use a hashtag with the promo to tell you what they think of your brand. Using the information you gather, you’ll be able to hear the truth of what customers thought of your promotion.
4. Achievement of Set Goals
Take another look at goals you set for the promotion. Does your data show that you have achieved them? While the principal, overarching goal of your promotion should have been to boost sales and increase brand recognition, another main goal of your promotion should be to record and analyze the results for future use. Even if your promotion was not “successful” in the way you planned, having accurate measurements of all of the factors at hand will allow you and your team to identify areas for improvement. As we mentioned earlier, sometimes a promotion can seem successful on the surface, but can actually have negative effects on long term profits. Make sure you are setting multiple goals ahead of your promotion so you are able to track metrics for all of them and determine the true effectiveness of your efforts.
The most successful promotions have these features:
-
friendly, communicative, and knowledgeable promoter
-
good in-store positioning
-
full stock of product
-
harmonized appearance of marketing materials
-
focus on brand recognition and increasing brand loyalty
From planning to implementing to analyzing, documenting the entire process of a promotion is vital to making it a success. But the only way to determine whether your promotions are truly effective is by accurately measuring the four metrics: profits, sales volume, customer satisfaction, and achievement of goals. Having these measurements makes your life easier when analyzing the outcome of your promotions, and empowers you to Learn from your mistakes and take note of what you did well. Next time, your promotions will be guaranteed to be even more successful.

![How to Analyze Success of Product Promotions [Free Toolkit]](https://www.repsly.com/hs-fs/hubfs/iStock_61166128_LARGE.jpg?width=770&height=404&name=iStock_61166128_LARGE.jpg)
.png?width=480&height=252&name=PRESS%20RELEASE-2%20(4).png)

