Planograms can be a great tool for optimizing and managing your products’ placement on shelves, but many brands struggle to see enough returns to justify the time and effort it takes to create and use them. When done right, planograms do wonders for your brand, so don’t give up just yet. In this post, we’ll walk you through how to combine your planograms with store level data and make them more than worth it.
First, we’ll do a brief refresher on planograms, and why they’re important.
What Is a Planogram?
A planogram is a visual representation of an item’s placement on shelves, usually in the form of a diagram or model. Planograms can be schematic, or have actual images of each product on the shelf. They are important for organizing and tracking shelf position, and suggesting optimum display for your brand’s merchandise to retailers. In addition, they are a useful tool when analyzing retail performance and identifying potential reasons for changes in sales.
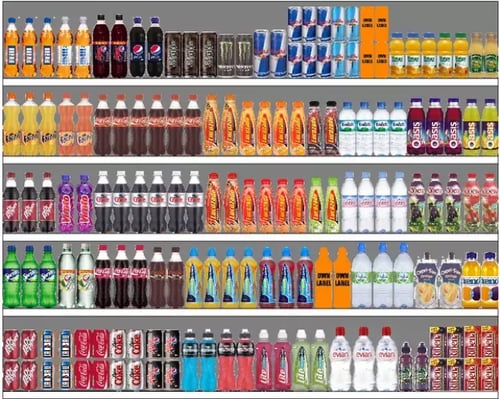 Image from Quora
With all of the uses that planograms serve for brands, shouldn’t you aim to get the most possible value from them? Now we’ll talk about how planograms and store level data can work hand in hand to take your brand to new levels of success.
Strengthen Your Planogram With Sales Data
Planograms work because they dictate the shelf placement of your brand's products in stores. By combining your planograms with store level sales data, you have more insight as to how you should go about this process.
Use sales numbers to identify high-selling and low-selling products at each store. Next, check your planogram to see how these numbers correlate with each product’s shelf positioning. Maybe you notice that products placed higher on the shelf or closer to complementary goods sell at a higher rate. You can then adjust your shelf positioning to boost the performance of products that may be lagging.
On the flip side, maybe your sales data demonstrates that a certain product is your most popular, regardless of position on the shelf. Wouldn’t you want to put this product where it will be most easily seen? Tweak your planogram to have your most popular items in the most valuable shelf space that your brand has.
Whatever changes you end up making, follow up on your sales numbers later to see if your tweaks have brought your desired results.
Compare Your Planogram to Observed Store-Level Data
So you’ve used sales data for a more accurate and profitable planogram, now it’s time to make sure it’s being implemented correctly. Another place where planograms are especially useful is in dealing with retailer noncompliance. It’s common that brands will send reps on store visits to identify and fix compliance issues. Combining a strong planogram with the observed data that your reps record from their visits will help your team to more effectively gauge and manage retailer compliance.
It goes like this: when your reps visit a store location, they’ll go to the shelves where your products are stocked. They’ll pull out their planogram, and see the agreed upon shelf layout.
Next, they’ll compare that to the current state of the shelf that they are observing. They may want to take a picture of how the shelf looks, which gives them a specific visual comparing how the shelf should look to how it actually looks.
Finally, they can use this as ammunition when confronting retail partners about the state of displays. Visually comparing the precise differences between your planogram and the actual display provides your reps with a much stronger argument when fighting for that prime real estate on the shelf.
Strengthen your planogram with specific store level data in order to increase the value you get from them. By following these easy tips, you can stop wondering if making that planogram is worth it, and start seeing new levels of retail sales.
For help designing a custom and tailored planogram, check out our free planogram template here!


.png?width=480&height=252&name=PRESS%20RELEASE-2%20(4).png)

